Excel
Mar 10, 2016
Excel What-if Analysis: Scenarios
If you think of Excel as just a database for storing dead data, you will be pleasantly surprised to learn about Excel's What-if analysis tools. Excel offers several features that allow a user to make predictions, or evaluate outcomes based upon variable inputs. In this article, we are going to look at Scenarios.
What is the Scenarios feature?
Scenarios take sets of input values and helps you determine possible results. Scenarios let you process multiple variables, but limits the number of values to 32. In our example, we will be running a scenario that evaluates how interest rate and term of a loan impacts the monthly payments and total interest paid. To follow using our example, download ExcelScenarios.xlsx
This feature was introduced in Excel 2010 and applies to 2010 and later. Images were taken using Excel 2013 on Windows 7.
Set Up Scenarios
- Select the cells you want to vary. In our example, we want to change the interest rate and number of months we have to pay back our loan.
- On the Data tab, select Scenario Manager from the What-if Analysis dropdown menu.
- Click Add in the Scenario Manager dialog box.
- Give the scenario a name and edit the comments if you wish. Click OK.
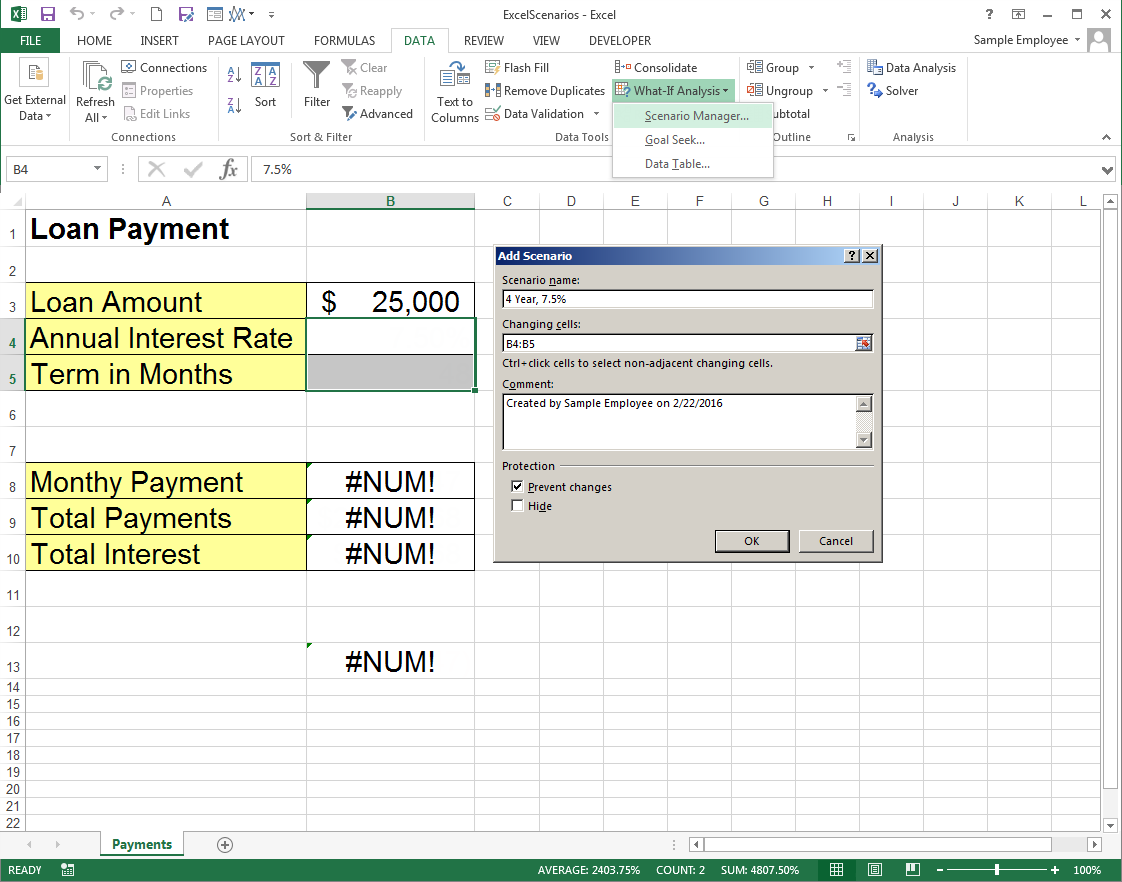
Note: In Excel 2016, What-if Analysis appears in the new Forecast Group.
- Type the values for the variables you want into the fields you originally selected in the Scenario Values dialog box.
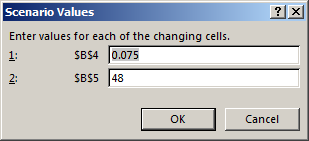
(Note that in this example the cell type is percentage but the dialog box expects you to enter the value you'll multiply by, not the percentage. Keep the cell type in mind when entering scenario variables.)
- Click OK to return to the manager, or Add to immediately create another scenario.
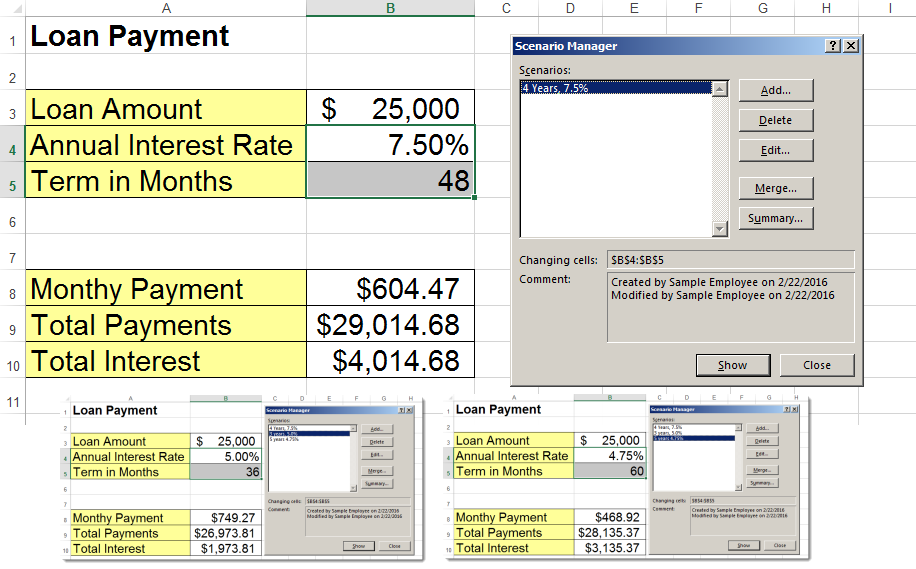
Show Your Scenarios
In the Scenario Manager dialog box, select the scenario you wish to see, then click Show. The variable cells will be filled with the values described in the scenario and the rest of your formulas will calculate based on those values.
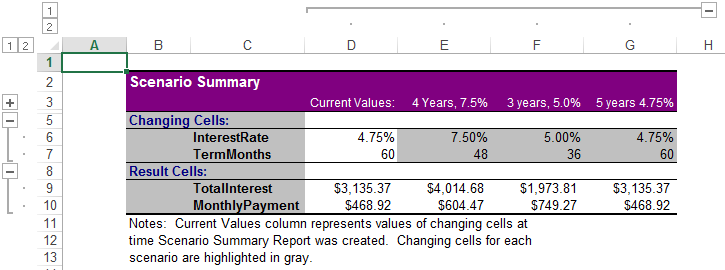
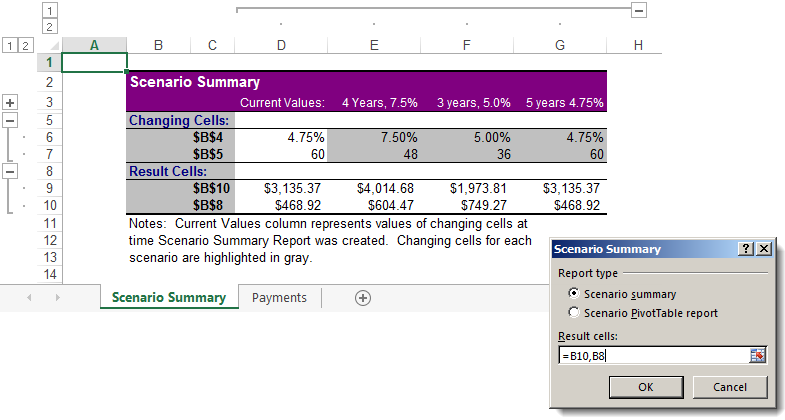
Create a Scenario Summary
The above is useful if you want to look at your scenarios one at a time. If you want to quickly compare your scenarios, then you'll want to create a Scenario Summary.
- Open the Scenario Manager and click Summary.
- In the Scenario Summary dialog box, choose a report type and then input the result cells. In our example, we would like to see the different results for monthly payments and total interest paid.
- Click OK.
Excel will open a new worksheet with a summary table based on all the variables you have entered.
Hint! If you Name your result cells and your variable cells, your summary table will be clearer and creating the scenarios will be easier.