Advanced Excel, Excel
Apr 24, 2026
Compound Annual Growth Rate: How to Calculate CAGR in Excel
Whether you're comparing investment returns, evaluating business revenue or sizing up a fund's advertised performance, you need a standardized metric to determine if a growth rate is actually good. The compound annual growth rate, or CAGR, gives you exactly that.
Say you review your IRA returns and consider changing your mix of investments. Five years ago, you invested $10,000 in a mutual fund that is now valued at $16,183. That's a gain of over $6,000, but it took five years. Is that good?
Now, another company advertises a fund with a five-year annualized growth rate of 12%. Surely it can't mean that the fund earns 12% every year, for aren't these investments iffy with frequent ups and downs? How can you compare your existing investment to the fund's 12% five-year percentage?
The good news is that you can do these calculations yourself, using Excel to find the CAGR of your current investment.
Key Takeaways
- The compound annual growth rate (CAGR) measures the average annual rate of return for an investment or business metric over a specific time period, smoothing out year-to-year volatility.
- The CAGR formula is (Ending Value / Beginning Value) ^ (1 / Number of Years) - 1, and you can calculate it easily in Excel.
- CAGR is useful for comparing investments, tracking business performance and setting growth targets, but it does not account for volatility or interim cash flows.
- For more complex scenarios involving periodic contributions, consider related metrics like Internal Rate of Return (IRR).
What Is Compound Annual Growth Rate (CAGR)?
Compound annual growth rate is the smoothed annualized rate of return that takes an investment (or any measurable value) from its beginning value to its ending value over a given time period. Rather than showing what happened in any single year, CAGR tells you the equivalent steady rate at which your money or metric would have needed to grow each year to reach the final result.
The key concept behind CAGR is compounding, meaning that each year's growth builds on the previous year's ending value. Because of this, CAGR captures the "growth on growth" effect that a simple average would miss. It is important to understand that CAGR is a theoretical rate. Your actual returns in any individual year will almost certainly differ from the CAGR figure.
CAGR is widely used in finance and accounting, business planning and investment analysis. Analysts use it to compare fund performance, executives reference it in earnings reports and business owners rely on it to evaluate revenue trends over time.
The CAGR Formula
To learn how to calculate CAGR, start with this formula:
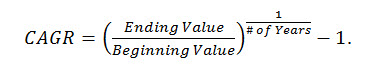
CAGR = (Ending Value / Beginning Value) ^ (1 / Number of Years) - 1
Here's what each variable means:
- Ending Value is the final value of the investment or metric at the end of the period.
- Beginning Value is the starting value at the beginning of the period.
- Number of Years is the total duration of the measurement period.
In Excel, you can enter this directly using the exponent operator (^). For example, if your beginning value is in cell B2, your ending value is in cell B7 and the period is five years, the formula would be: =(B7/B2)^(1/5)-1. You can also use the POWER function: =POWER(B7/B2,1/5)-1.
Why CAGR Matters
CAGR is one of the most practical metrics in finance and business because it provides a single number that captures growth over time. Here are the most common reasons to use it:
- Comparing investments on equal footing. Two funds with different yearly swings can be compared side by side using their CAGR values, removing the noise of individual-year performance.
- Evaluating historical business performance. Revenue, profit and customer counts can all be measured with CAGR to show how a company has grown over three, five or 10 years.
- Setting realistic growth targets. If your company's historical revenue CAGR is 8%, you can use that as a baseline when planning future budgets and forecasts.
- Benchmarking against industry averages. CAGR lets you compare your performance to published industry growth rates using the same methodology.
- Communicating growth to stakeholders. A single annualized growth rate is easier for investors, board members and partners to understand than a table of yearly fluctuations.
An Example of Compound
Compound growth means that, because your investment's value gains a little bit each year (you hope!), you have more to invest in the following year. Consider this example:
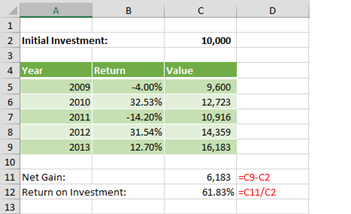
If you invested $10,000 at the beginning of 2009, you might have been concerned at the end of the year when your $10,000 had fallen to only $9,600 (a -4% return), but you would have been elated a year later when it climbed to $12,723. By the end of five years, your $10,000 investment had grown to $16,183.
To calculate the net gain, simply subtract the initial value from the ending value. C9 – C2 = $6,183. This shows the absolute number of dollars gained, but it tells you nothing about the rate of return. Is this gain good? The answer is, "It depends." Think of it this way: If you invested $75 and gained $6,183, you'd be thrilled; but if you invested several million dollars and had a gain of only $6,183, you'd fire your financial advisor. So is this return on an investment of $10,000 good?
Line 12 adds more information. The return on investment is the net gain divided by the initial investment. This is a 61.83% return. Generally speaking, a higher number is better, but it still doesn't tell us anything about the timeframe.
The returns each year are volatile in this example, and simply averaging the values in Column B will not produce a useful metric.
The Answer Is in the Compound Annual Growth Rate
The CAGR is an estimate of the rate of return per year. The CAGR is the imaginary rate of growth that, if compounded annually, is equivalent to what your investment achieved over a period of time. It is important to understand that a variable investment does not actually grow at this rate every year—some years it's higher, and some years it's lower, as in the example above—but it provides a useful means of comparing one investment to another.
To calculate CAGR, use the formula:
In the example above:
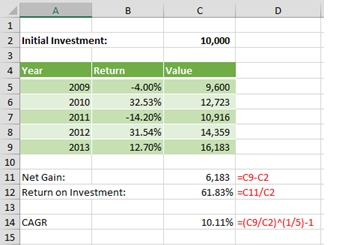
The CAGR for your investment is 10.11% per year. In other words, if you could have invested your $10,000 in a fund that returned exactly 10.11% per year, then at the end of five years, you'd have the same $16,183 that your investment produced. That's what it means to say that the CAGR is equivalent to the rate of return your investment.
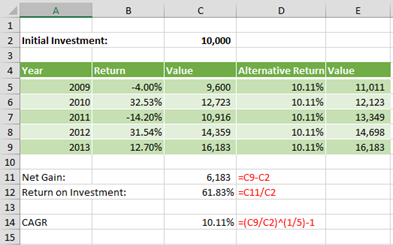
Note that, although this is a useful measure for comparing investments, it is far from the only thing you'll need to consider. For example, CAGR does not measure volatility. The example above had wild swings from year to year, and some investors don't have the stomach for it. A savings account or CD returns exactly the same amount every year, just like the imaginary alternative investment, although it's rare to find a fixed investment that pays as well as stocks and mutual funds. These are some factors to consider when finding your investment style and making your investment choices, and none of these factors are covered by the CAGR formula.
Limitations of CAGR
While CAGR is a powerful tool, it has important limitations you should understand before relying on it as your sole metric:
- Does not reflect volatility or risk. CAGR smooths out all the ups and downs into a single number. Two investments can have the same CAGR but wildly different risk profiles. One might deliver steady 10% gains each year while another swings between -20% and +40%.
- Assumes steady growth that rarely occurs. By design, CAGR presents growth as if it happened at a constant rate. In reality, markets and businesses experience uneven growth, and the path matters to investors who may need to withdraw funds at an inopportune time.
- Ignores interim cash flows. If you make additional deposits or withdrawals during the measurement period, CAGR cannot account for them. It only considers the beginning value and the ending value.
- Only useful for comparing identical time periods. A five-year CAGR and a 10-year CAGR are not directly comparable because market conditions, economic cycles and compounding effects differ across timeframes.
- Less reliable for very short periods. Over one or two years, a single strong or weak year can distort the CAGR and make it misleading as a measure of long-term potential.
CAGR vs. Other Growth Metrics
Understanding how CAGR compares to related metrics helps you choose the right tool for the job.
| Metric | What It Measures | Best Used When | Key Limitation |
|---|---|---|---|
| CAGR | Smoothed annualized return between a start and end value | Comparing investments or business metrics over the same time period | Ignores interim cash flows and volatility |
| Average Annual Growth Rate (AAGR) | Simple arithmetic average of each year's growth rate | You need a quick snapshot of yearly performance | Overstates actual growth because it ignores compounding |
| Internal Rate of Return (IRR) | Annualized return accounting for multiple cash flows at irregular intervals | You make periodic contributions or withdrawals | More complex to calculate; can produce multiple solutions |
| Absolute Return | Total percentage gain or loss over the entire period | You want to know the total gain without regard to time | Tells you nothing about the annualized rate of return |
- CAGR vs. AAGR: The average annual growth rate simply adds up each year's percentage change and divides by the number of years. Because it ignores compounding, AAGR tends to overstate the true growth rate. CAGR gives you the actual equivalent compounded rate.
- CAGR vs. IRR: If you're making regular contributions to a retirement account or reinvesting dividends at different intervals, IRR is the better choice. CAGR only works cleanly when you have a single lump-sum investment with no additions or withdrawals.
- CAGR vs. absolute return: Absolute return tells you the total gain (like the 61.83% in our example), but it doesn't tell you how long it took. CAGR normalizes that gain into an annual figure so you can compare it to other opportunities.
What Is a Good CAGR?
The answer depends on the asset class, industry, time period and your personal risk tolerance. There is no universal "good" number, but benchmarks can help you evaluate your results.
For stock market investments, the S&P 500 has delivered a historical CAGR of roughly 10% over long periods. Small-cap stocks have historically produced higher CAGRs but with significantly more volatility. Fixed-income investments like bonds typically show CAGRs in the 4% to 6% range, while savings accounts and CDs fall well below that. If your investment CAGR meaningfully exceeds the relevant benchmark for its asset class, you're doing well.
For business metrics like revenue or profit, a "good" CAGR varies widely. Early-stage startups might target 40% or higher, while mature companies in stable industries may consider 5% to 10% strong. The key is to compare your CAGR against direct competitors and industry averages rather than applying a one-size-fits-all standard. Context always matters more than the number itself.
Next Steps
While the CAGR formula is a good start for comparing investments, you'll want to examine additional formulas and methods to evaluate more complicated investments. For example, you'll need the Standard Deviation (STDEV.S() or STDEV()) to measure volatility. If you're adding to your investments periodically, you might need to calculate the Internal Rate of Return using IRR() or XIRR(), as covered in the CAGR vs. Other Growth Metrics section above.
The good news is that Excel has an entire section filled with financial calculations.
If you want to build your Excel skills further, Pryor Learning offers hands-on Excel training courses that cover financial functions, data analysis and more. Whether you're calculating CAGR for a single investment or building complex financial models, strengthening your spreadsheet skills will pay dividends in every area of your career.


