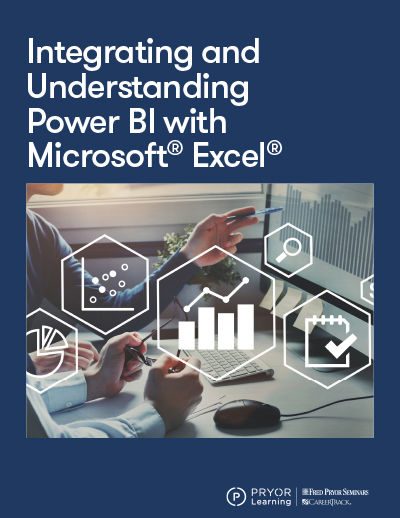
Integrating and Understanding Power BI® with Microsoft® Excel®

Developing effective dashboards, data sets and informative reports

Continuing Education Credits: CEU: 0.3 

Download Brochure

Half-Day Seminar

$149/Person

$139 for groups of 5 or more

Choose an Event

LIVE ONLINE SEMINARS
Oct (2)
Nov (6)
Dec (8)

PRIVATE TEAM TRAINING

Bring this topic or 200+ other training opportunities to your location in-person or online.

Request Onsite Training

Already attended this seminar?

Rate and Get Certificates

View additional Computer Software training

"I have been a member of Fred Pryor for almost three years now and I have yet to attend a class that didn't have valuable information that would benefit my company and/or our employees."

— Teri M.

"Excellent!! As always, Fred Pryor's courses are easy to follow, very informative and presented in a format that keeps your attention!!"

— Cynthia S.

"I enjoy all of the seminars that I attend through the Fred Pryor Training Rewards program. They are very informative and the instructors are very knowledgeable and helpful."

— Tasha M.

"Excellent info for all levels of users. There are always things to add to your "bag of tricks"."

— Wendy S.

"Wow! I have taken many wonderful courses through Fred Pryor; this one takes the cake!!"

— Dana N.

"Top notch! Thank you Fred Pryor, this is the best investment my boss could have made."

— Lewis C.

"I received a lot of great information in this training. Several co-workers went with me which was a great help for me to start implementing some of the changes we need to do at the office. It was very eye opening for them to realize the things that we need to do at the office. It was very eye opening for them to realize the things that need to get to me. It was like Fred Pryor and the trainer had my back!"

— Tasha C.

Overview

Microsoft Power BI is an innovative, collaborative tool that extracts the most essential information from a spreadsheet, or combined spreadsheets, and places it within an easy, one-page, at-a-glance view. Better protect and present your data across Power BI dashboards, data sets and reports with persistent protection that keeps working even when shared outside your organization or exported to other formats such as Excel, PowerPoint, or as a PDF. Additionally, this 3.5-hour interactive seminar is designed to help Power BI and Excel users better extract, interpret and present compelling data to help drive important business decisions. Attendees will learn about DAX (Data Analysis Expressions), which is a formula language that introduces new ways to calculate data values for informative and innovative analysis.

Together with Excel, Microsoft Power BI is changing the way organizations are extracting, reviewing and implementing big data. Using Power BI to decipher trends and make comparisons, allows organizations to see the data from several different visualizations, to drive business decisions and anticipate where to focus efforts. Attend, interact and discover how to turn insights into action and create amazing data experiences in this comprehensive seminar on Power BI and Excel.

What You'll Learn

  • Tips for installing the application and merging with other tools.
  • Understanding and navigating the Power BI environment and how to integrate with Excel.
  • Discover new ways to calculate data with DAX.
  • How to create and modify data visualizations.
  • Methods to merge data from multiple sources.
  • Strategies to build effective dashboards for sharing and presentation.
  • Processes for saving, comparing and publishing effective, detailed and comprehensive reports.

Who Will Benefit

This course is for all Excel users, regardless of iOS or PC platform. A basic knowledge of formulas and functions, charts, dashboards, Pivot Tables, Pivot Charts, Relational databases, sparklines and conditional formatting is recommended.