Excel
May 13, 2026
What-If Analysis in Excel: How to Use Scenario Manager
Key Takeaways
- What-If Analysis in Excel includes three tools: Scenario Manager, Goal Seek and Data Tables, each suited to different types of variable modeling.
- Scenario Manager lets you define up to 32 variable values per scenario and compare outcomes side by side with a Scenario Summary report.
- Setting up scenarios requires selecting your variable cells, naming each scenario and entering alternate values for each.
- Naming your variable and result cells before creating scenarios makes your summary reports clearer and easier to interpret.
What Is What-If Analysis in Excel?
If you think of Excel as just a database for storing dead data, you will be pleasantly surprised to learn about Excel's What-if analysisIf you think of Excel as just a database for storing dead data, you will be pleasantly surprised to learn about Excel's What-If Analysis tools. Excel offers several features that allow a user to make predictions, or evaluate outcomes based upon variable inputs. In this article, we are going to look at Scenarios.Whether you are modeling loan payments, testing pricing strategies or building a budget forecast, What-If Analysis lets you change input values and instantly see how those changes affect your formula results.
What is the Scenarios feature?Business professionals use What-If Analysis for a wide range of decisions, including:
- Forecasting revenue under different growth assumptions
- Modeling loan payments across varying interest rates and terms
- Evaluating pricing scenarios and their impact on profit margins
- Budgeting with best-case, worst-case and most-likely projections
- Running sensitivity analysis on key financial variables
Excel provides three built-in tools under the What-If Analysis menu on the Data tab. Each tool approaches variable modeling differently, and understanding all three helps you pick the right one for your situation. In this article, we are going to take a deep look at Scenario Manager, the most flexible of the three tools for comparing named sets of assumptions.
Three Types of What-If Analysis Tools in Excel
Before diving into the step-by-step walkthrough, it helps to understand how the three What-If Analysis tools compare. Each one is designed for a different type of question.
1. Scenario Manager
Scenario Manager lets you create and save multiple sets of input values and switch between them. It supports up to 32 changing cells per scenario, making it the best choice when you want to compare named cases such as best case, worst case and most likely. You can also generate a Scenario Summary report that displays all scenarios side by side on a single worksheet.
2. Goal Seek
Goal Seek works backward from a desired result to find the input value needed to achieve it. It handles only one variable at a time, which makes it ideal for single-variable problems. For example, you might use Goal Seek to answer, "What interest rate do I need to keep my monthly payment under $500?"
3. Data Tables
Data Tables automatically calculate results for many input values at once. You can build a one-variable data table to test a range of values for a single input or a two-variable data table to test combinations of two inputs simultaneously. Data Tables are best for sensitivity analysis where you want to see results across a continuous range of values.
The table below summarizes the key differences
| Feature | Scenario Manager | Goal Seek | Data Tables |
|---|---|---|---|
| Best For | Comparing named cases | Finding a specific input | Sensitivity analysis |
| Variables | Up to 32 | 1 | 1 or 2 |
| Direction | Forward (input to result) | Backward (result to input) | Forward (input to result) |
| Output | Scenario Summary report | Single cell update | Table of results |
How to Use Scenario Manager in Excel (Step by Step)
Scenarios take sets of input values and helps you determine possible results. Scenarios let you process multiple variables, but limits the number of values to 32The following steps walk through creating, viewing and summarizing scenarios using a loan payment example. In our example, we will be runningrun a scenario that evaluates how interest rate and term of a loan impacts the monthly payments and total interest paid. To follow using our example, download ExcelScenarios.xlsxalong, download ExcelScenarios.xlsx.
This feature was introduced in Excel 2010 and applies to 2010 and later. Images were taken using Excel 2013 on Windows 7.
Set Up Scenarios
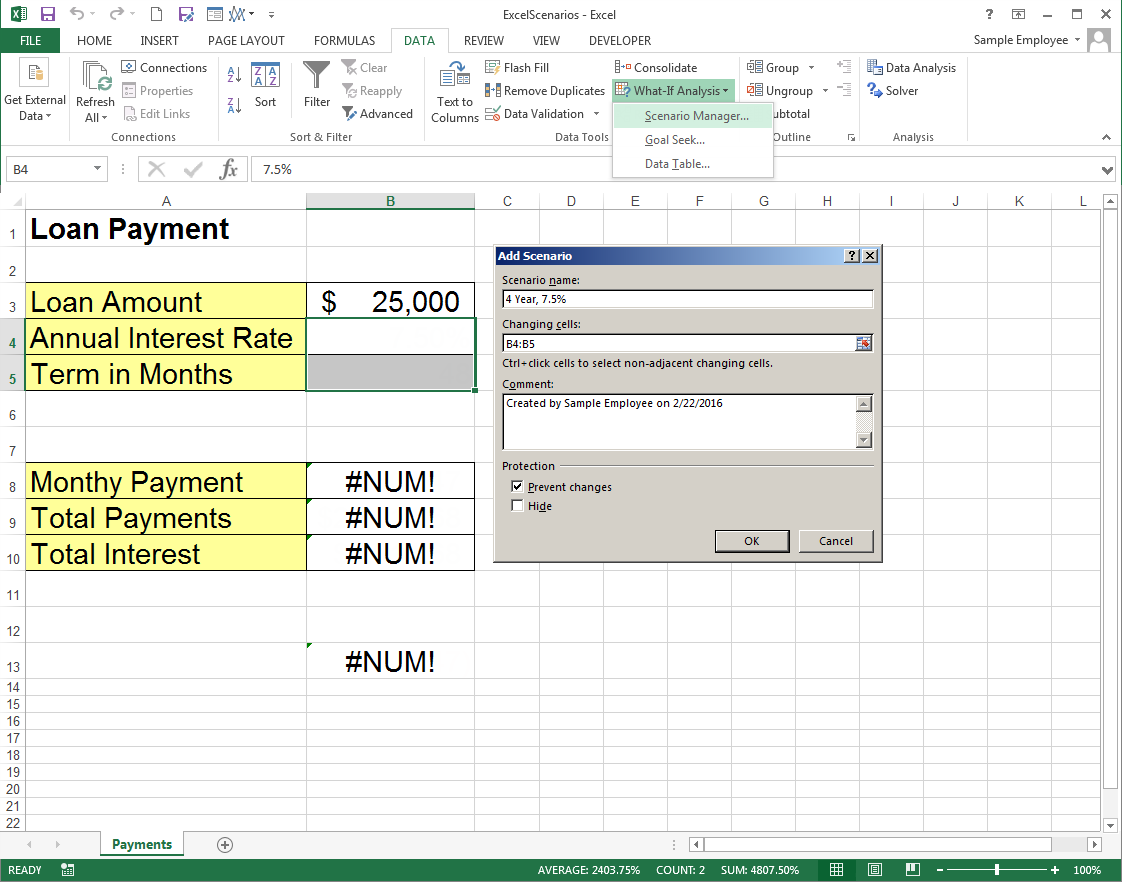
1) Select the cells you want to vary that contain the values you want to change across scenarios. In our example, we want to change the interest rate and number of months we have to pay back our loan.
2) On the Data tab, select Scenario Manager from the What-if Analysis dropdown menu.
3) Click Add in the Scenario Manager dialog box.
4) Give the scenario a name and edit the comments if you wish. Click OK.
Note: In Excel 2016, What-if Analysis appears in the new Forecast Group.
5) Type the values for the variables you want into the fields you originally selected in the Scenario Values dialog box.
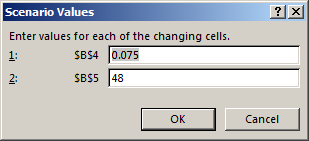
(Note that in this example the cell type is percentage but the dialog box expects you to enter the value you'll multiply by, not the percentageif the cell is formatted as a percentage, enter the decimal equivalent in the dialog box (e.g., enter 0.05 for 5%). Keep the cell type in mind when entering scenario variables.)
6) Click OK to return to the manager, or Add to immediately create another scenario.
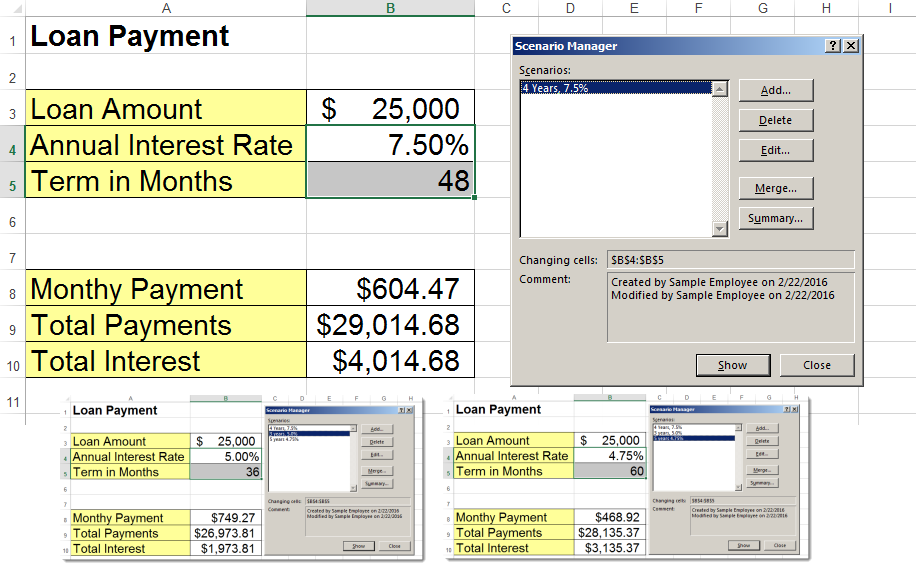
Show Your Scenarios
In the Scenario Manager dialog box, select the scenario you wish to see, then click Show. The variable cells will be filled with the values described in theupdate to the values defined in that scenario and the rest of your formulas will calculate based on those values.
Create a Scenario Summary
The above is useful if you want to look at your scenarios one at a time. If you want to quickly compare your scenarios, then you'll want to create a Scenario Summary.
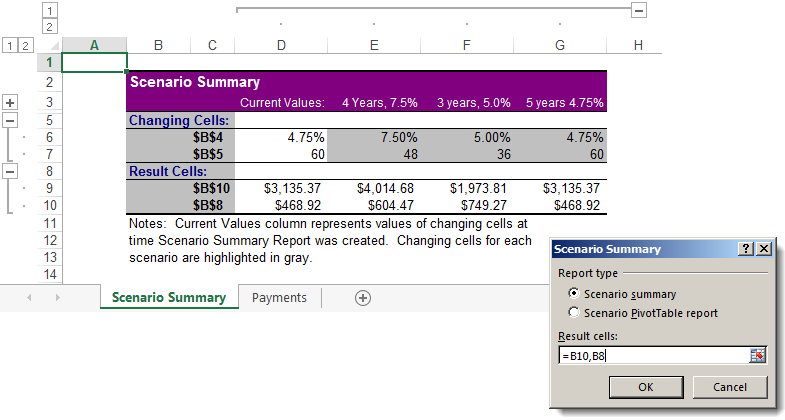
- Open the Scenario Manager and click Summary.
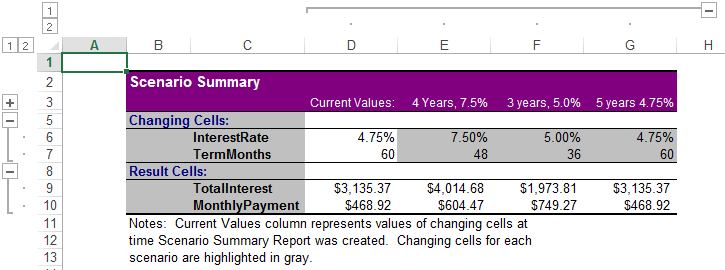
- In the Scenario Summary dialog box, choose a report type and then input the result cells. In our example, we would like to see the different results for monthly payments and total interest paid.
- Click OK.
Excel will open a new worksheet with a summary table based on all the variables you have entered.
Hint! If you Name your result cells and your variable cells, your summary table will be clearer and creating the scenarios will be easier.
When to Use Each What-If Analysis Tool
Now that you know how Scenario Manager works, here is a quick guide to help you decide which tool fits your situation:
- Use Scenario Manager when you have named cases with multiple changing variables and you want to switch between them or generate a side-by-side comparison. It is the best choice for presentations and reports where stakeholders need to see distinct outcomes labeled by name.
- Use Goal Seek when you already know the result you want and need to find the single input value that gets you there. It is fast and straightforward for one-variable problems.
- Use Data Tables when you want to see how results change across a continuous range of one or two input values. A one-variable data table tests many values for a single input, while a two-variable data table tests combinations of two inputs at once.
These tools can complement each other. For example, you might start with Goal Seek to find a target interest rate, then use Scenario Manager to build named cases around that rate and finally create a Data Table to visualize sensitivity across a broader range.
Tips for Effective What-If Analysis in Excel
These practical tips will help you get more out of your scenario modeling:
- Name your variable cells and result cells before building scenarios. Named cells make the Scenario Summary report far easier to read and reduce errors when selecting ranges.
- Start with a working base-case model. Confirm that all your formulas calculate correctly before adding scenarios so you can trust the results.
- Use Scenario Summary reports to present findings to stakeholders. The auto-generated table on a separate worksheet is clean enough to drop into a slide deck or email.
- Combine Scenario Manager with charts for visual impact. Link a chart to the cells affected by your scenarios and the chart will update each time you show a different scenario.
- Document your assumptions for each scenario. Use the Comments field in the Scenario Manager dialog box or add notes in adjacent cells so anyone reviewing the file understands the logic behind each case.
Build Your Excel Skills with Pryor Learning
Mastering What-If Analysis is just one step toward becoming more confident and productive in Excel. Pryor Learning offers instructor-led Excel training covering What-If Analysis, advanced formulas, pivot tables and more. Whether you prefer live seminars or on-demand courses, Pryor has options designed to fit your schedule and skill level.


