Management, Supervision & Leadership
Apr 28, 2026
How to Create a Flowchart in Excel: A Step-by-Step Guide
Key Takeaways
- You can create a flowchart in Excel using the Shapes tool on the Insert tab, no special software required.
- Understanding standard flowchart shapes (rectangles, diamonds, ovals) helps readers interpret your diagram correctly.
- Excel's alignment, distribution and connector tools let you build polished, professional flowcharts in minutes.
- For faster results, consider Excel's SmartArt graphics or the Visio Data Visualizer add-in as alternatives.
You can create a flowchart in Excel using the built-in Shapes library on the Insert tab. Because most professionals already have Excel installed and know their way around the interface, it's a practical choice for documenting processes without investing in specialized diagramming software. Excel's grid-based layout also makes it easier to align and space shapes precisely, which gives your finished diagram a clean, professional look. Is Excel good for flowcharts? For simple to moderately complex process diagrams, it's one of the most accessible tools available.
This guide walks you through the manual Shapes method step by step, covers what each standard symbol means and introduces alternative approaches like SmartArt and the Visio Data Visualizer add-in.
Flowchart Basics: Shapes, Symbols and When to Use Them
A flowchart is a visual diagram that maps out the logical order of steps in a process, the decisions you must make along the way and the outcomes of those decisions. Flowcharts make complex workflows easier to understand, communicate and improve. Before you start building one in Excel, it helps to know what the standard flowchart shapes mean so your audience can read the diagram correctly.
Standard Flowchart Shapes and Their Meanings
The shape of each flowchart element tells the reader what function that step fulfills. Using elements in nonstandard ways risks confusing your audience, so stick to the conventions below.
| Shape Name | Image | What It Represents | When to Use It |
|---|---|---|---|
| Oval (Terminator) |  |
The beginning or end of your flowchart | Mark the start and finish of every process |
| Rectangle (Process) |  |
A process to carry out, such as a workflow procedure | Represent an action or task that must be completed |
| Predefined Process |  |
A predefined process, such as a commonly repeated subroutine | Reference a process documented elsewhere |
| Parallelogram (Data) |  |
A data source, such as a database table or other input | Show where data enters or exits the process |
| Diamond (Decision) |  |
A decision, such as evaluating whether a prior process completed properly. Connectors flow out from each corner of the diamond, depending on the outcome. | Represent a yes/no or true/false branch in the process |
| Document | (Rectangle with a wavy bottom edge) | A document or report generated by the process | Show printed or digital output |
When to Use a Flowchart
Flowcharts are useful any time you need to make a process visible and easy to follow. Common workplace use cases include:
- Documenting standard business processes for team reference
- Mapping onboarding workflows for new employees
- Building decision trees for troubleshooting or customer support
- Creating compliance and audit documentation
- Planning project phases and approval sequences
- Visualizing software or system logic before development
If your work involves explaining "how things get done," a flowchart in Excel can save time and reduce miscommunication.
How to Make a Flowchart in Excel Step by Step
This section consolidates everything you need into a single numbered walkthrough, from planning your process to locking down the final layout.
Step-by-Step Instructions
1) Plan your process first. Because a flowchart's purpose is to outline the logical order in which events must occur, the decisions you must make and the outcomes of those decisions, most people find it easier to build a flowchart if they first invest a few minutes organizing their thoughts. A flowchart with haphazard, poorly thought-out steps accomplishes little good. So take a few minutes to make notes. The format isn't important; just be sure to list each step in the process and identify each decision and possible outcome.
2) Prepare your worksheet. Before inserting shapes, set up your spreadsheet so alignment is easier. Adjust column widths to create a roughly square grid, which gives you a more predictable canvas. Then turn on Snap to Grid by going to Page Layout > Align > Snap to Grid. This ensures shapes lock neatly to cell boundaries as you draw them.
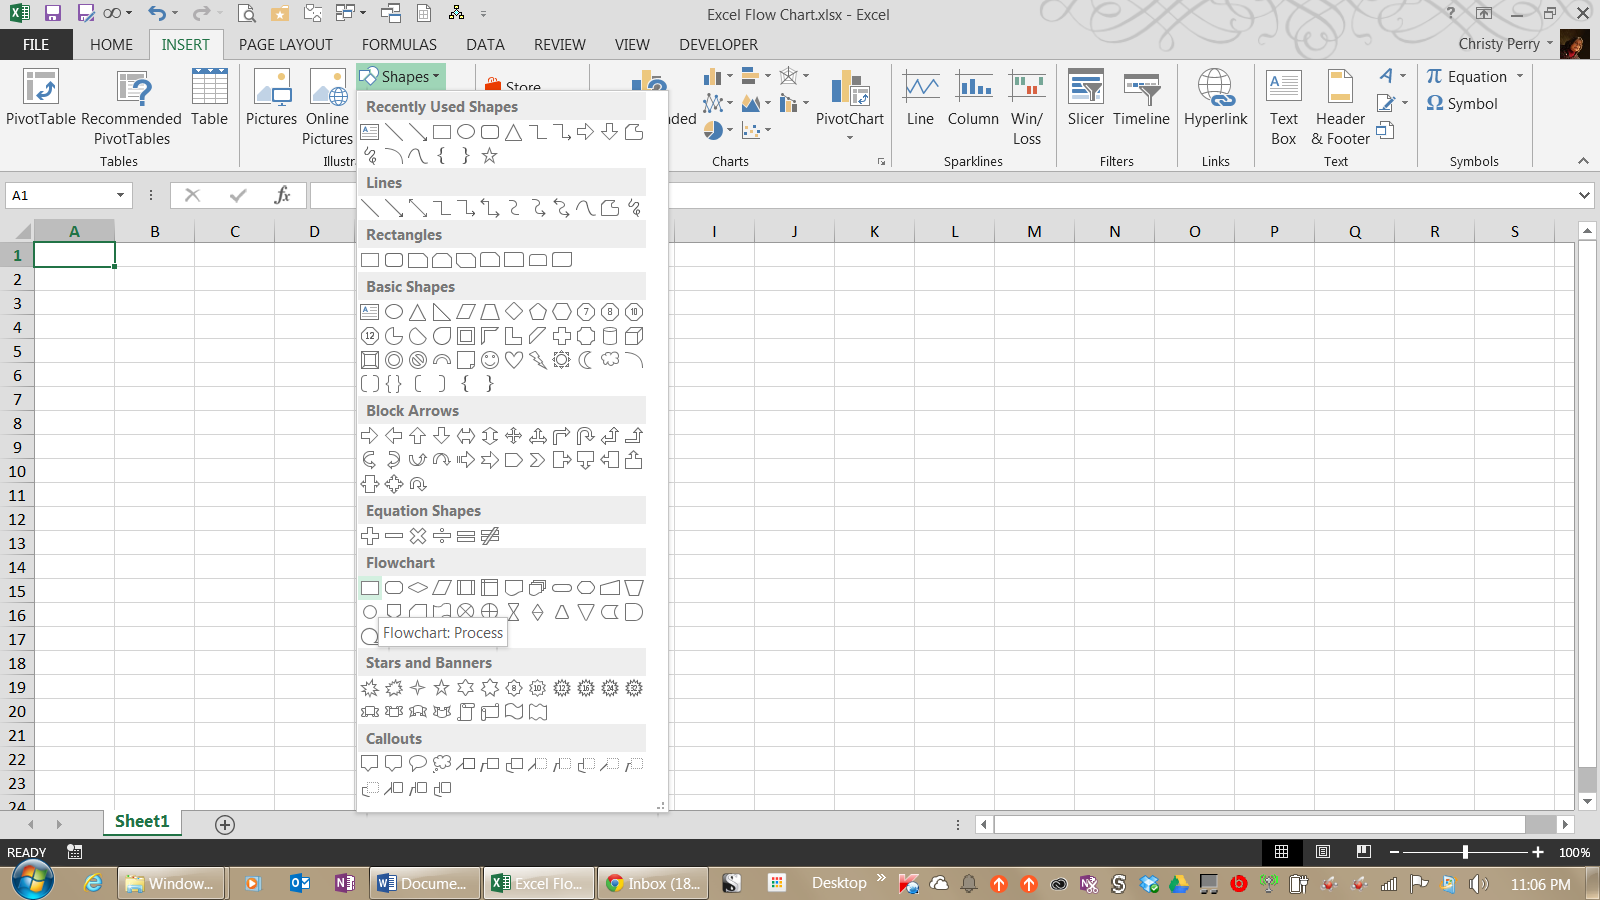
3) Insert your first shape. From the Insert tab, choose Shapes. Scroll down until you find the Flowchart group and select the appropriate shape for your first step (typically an oval terminator for "Start"). Click and drag on the worksheet to draw it.
4) Add text to the shape. Right-click the shape and, from the pop-up menu, choose Edit Text. Type the step name or a brief description of the action.
5) Format the shape. From the Format tab, select a style and color scheme. Keep colors consistent for each shape type throughout your flowchart so readers can quickly distinguish processes from decisions.
6) Repeat for all steps. Add a shape for every step, decision and endpoint in your outline. Refer to the shape meanings table above to choose the correct symbol for each element.
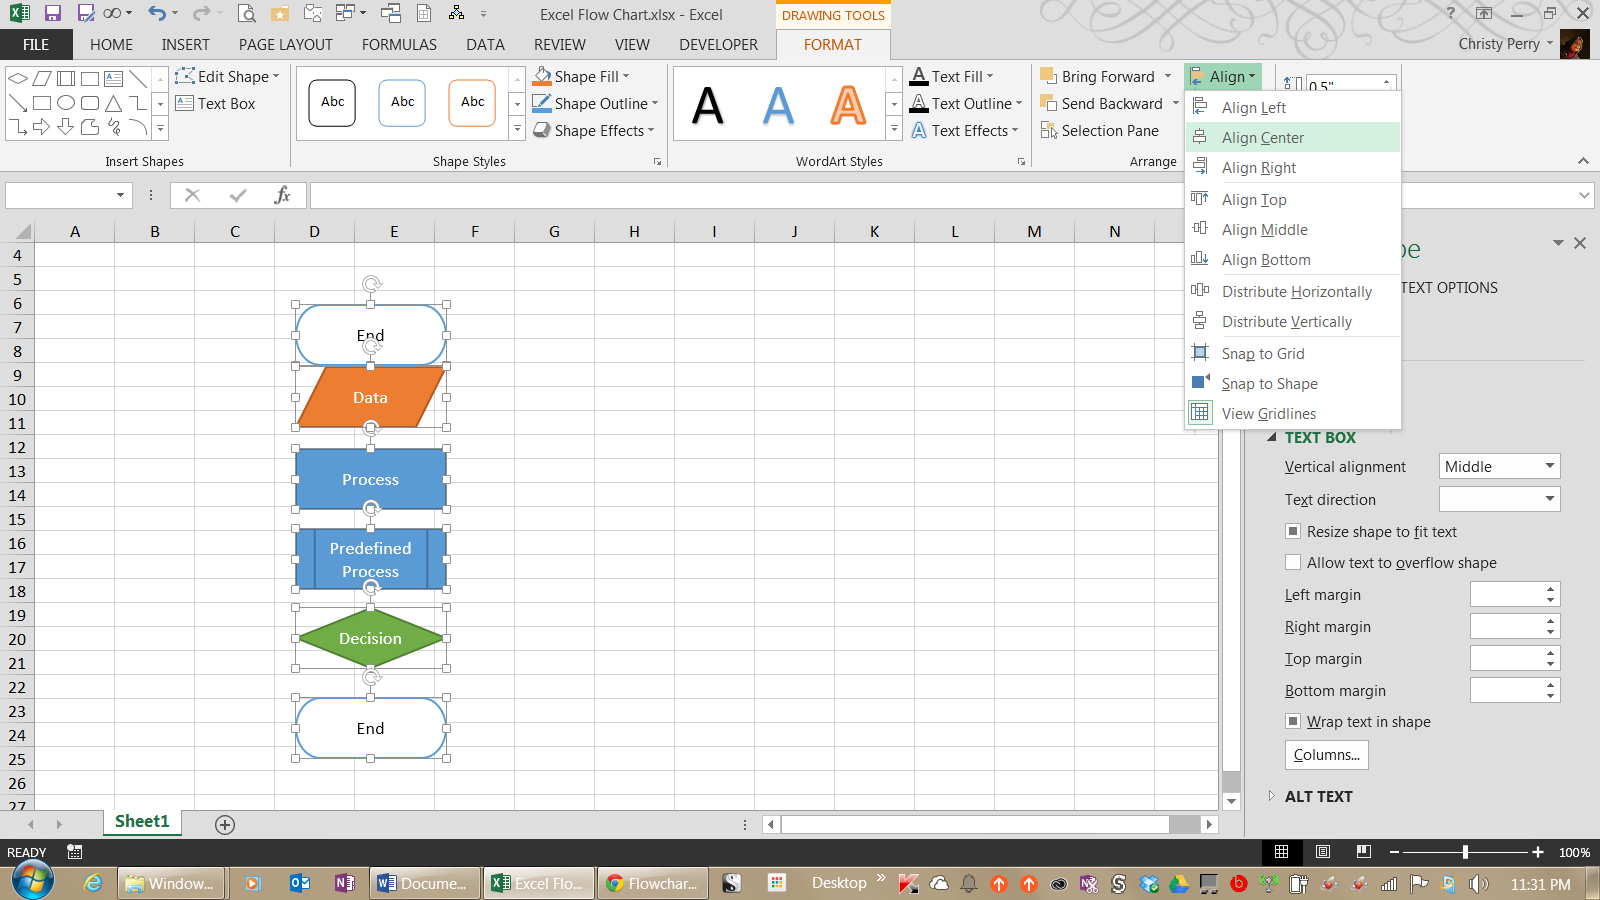
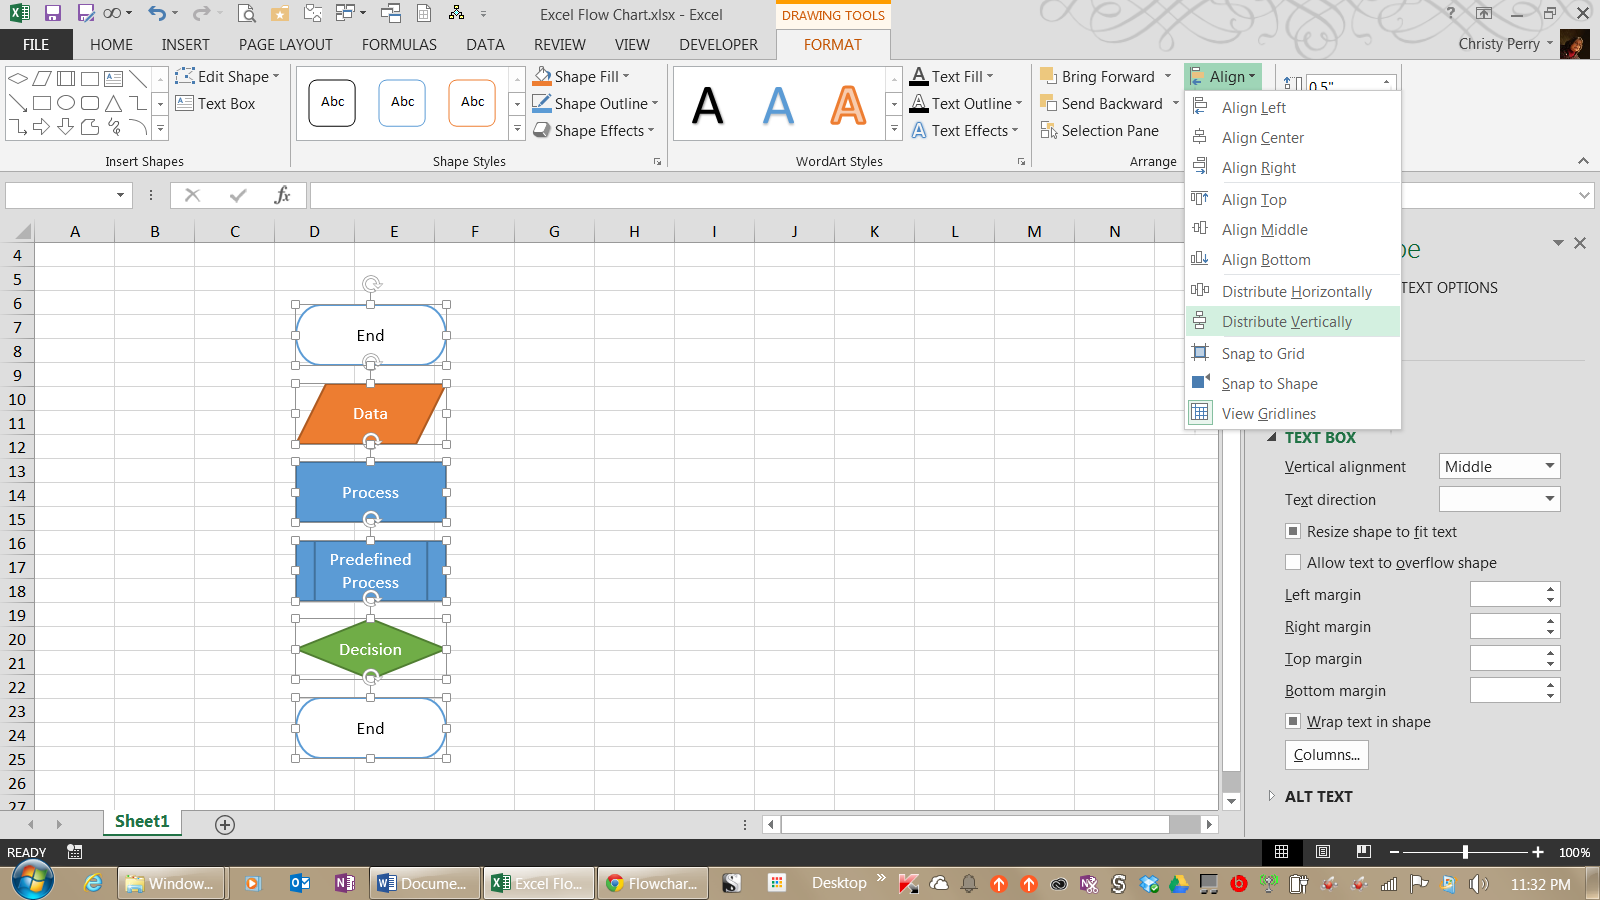
7) Align and distribute shapes. Select multiple elements by holding the SHIFT key while clicking each item, then choose Align Center from the Format ribbon to line them up in a column. To space the items out evenly, select multiple elements and choose Distribute Vertically from the Format ribbon. Double-check the sizes for consistency. Make all elements the same height and width for a polished and professional look—applying sound layout and design principles makes any flowchart easier to read. You can adjust each element's height and width by selecting the item and modifying the parameters on the Format tab.
8) Add connectors. From the Insert tab, choose Shapes and add either a straight line or an elbow line. Use a straight line to connect two elements in direct sequence. Use an elbow line when the connector must bend, such as to return to a prior step after a decision diamond. To add arrowheads, select the connector, go to Format > Shape Outline > Arrows and choose the arrow style you want.
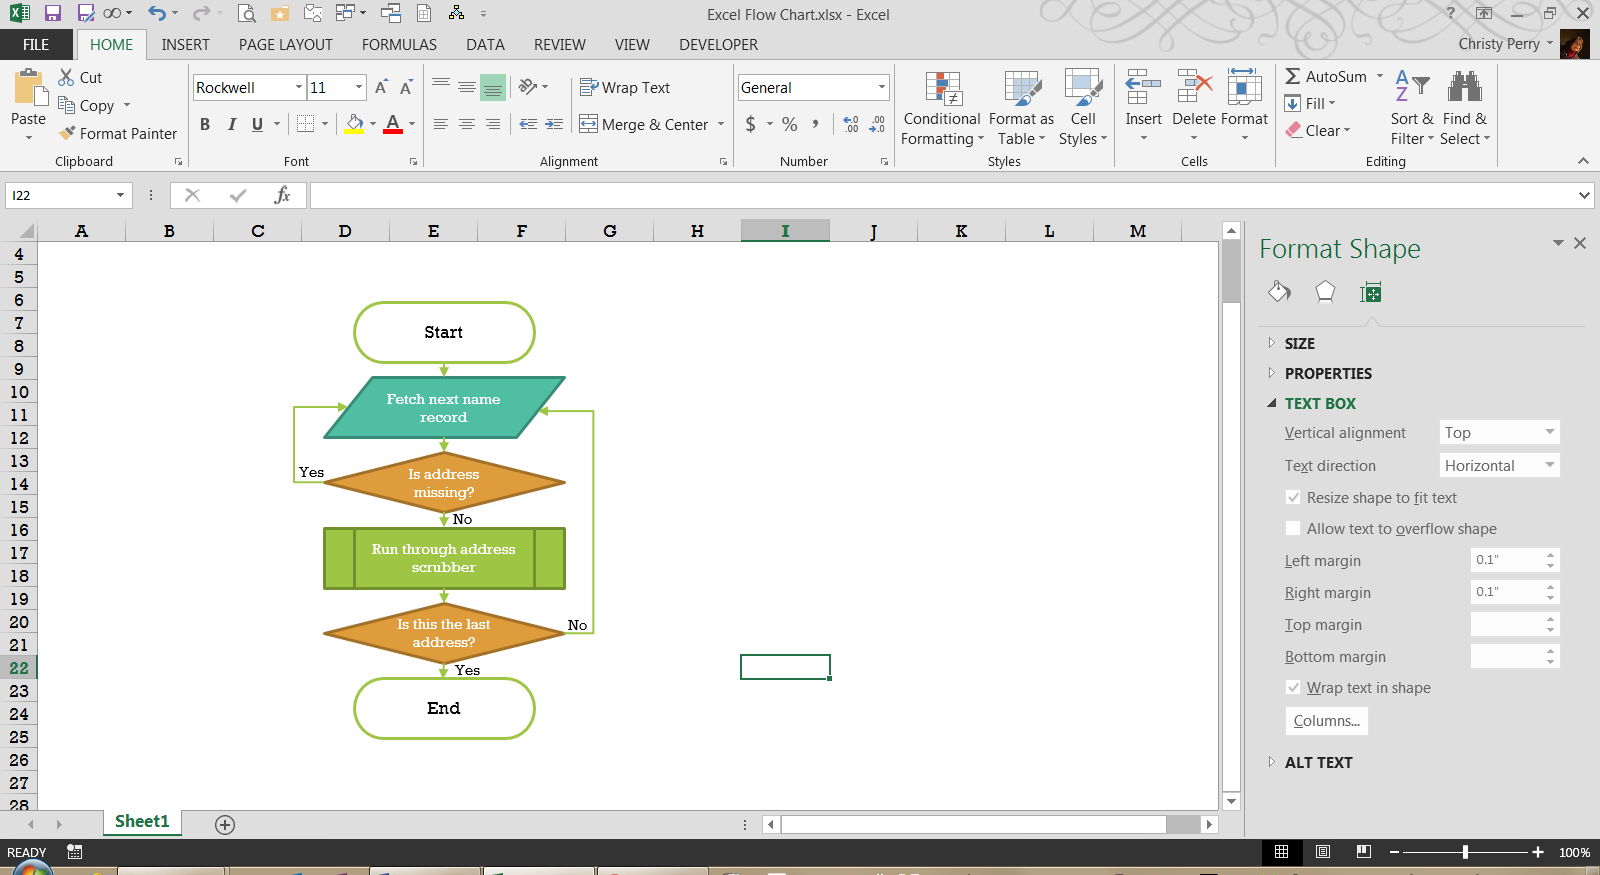
9) Label decision paths. Insert small text boxes near the connectors flowing out of each decision diamond. Label them "Yes" and "No" (or the relevant outcomes) so readers know which path corresponds to which result.
10) Group and finalize. Select all shapes and connectors by pressing CTRL+A or by dragging a selection box around the entire flowchart. Right-click and choose Group > Group. This locks the layout so it moves and resizes as one unit, preventing accidental misalignment later.
Alternative Ways to Build Flowcharts in Excel
The Shapes method gives you the most control, but Excel offers faster alternatives when you need a quick diagram or when your organization has access to additional Microsoft tools.
Using SmartArt for Quick Flowcharts
SmartArt is built into Excel and provides pre-designed layouts that handle alignment and formatting automatically. Here's how to use it:
- Go to Insert > SmartArt.
- In the dialog box, select the Process category from the left panel.
- Choose a layout such as Basic Bending Process or Vertical Process and click OK.
- Type your step names into the text pane that appears beside the graphic. Press Enter to add new steps.
- Customize colors and styles using the SmartArt Design tab on the ribbon.
SmartArt works best for simple, linear processes. It's less flexible than manual Shapes for complex decision trees with multiple branches, but it can cut your build time significantly when the process is straightforward.
Comparison: Excel Shapes vs. SmartArt vs. Visio
| Criteria | Excel Shapes | SmartArt | Microsoft Visio |
|---|---|---|---|
| Ease of Use | Moderate - manual placement required | Easy - auto-layout | Moderate - dedicated interface |
| Flexibility | High - full control over every element | Low - limited to preset layouts | Very high - advanced diagramming features |
| Best For | Custom flowcharts with decision branches | Simple linear processes | Large, complex or data-linked diagrams |
| Cost | Included with Excel | Included with Excel | Separate license or Microsoft 365 plan |
| Learning Curve | Low if you know Shapes basics | Very low | Moderate |
Excel vs. Word: Both applications use the same Shapes and SmartArt tools, so the core process is nearly identical. However, Excel's grid-based layout makes it easier to align and space shapes precisely, which is why many users prefer it for multi-branch flowcharts. Word may be more convenient if your flowchart will live inside a text-heavy document, particularly for users comfortable with advanced Word features.
Visio Data Visualizer Add-in
Organizations with Microsoft 365 subscriptions that include Visio can use the Visio Data Visualizer add-in to auto-generate flowcharts directly from Excel data tables. You define your process steps, connectors and shape types in a structured table, and the add-in builds the diagram for you. This is a powerful option for larger organizations that need to create and update flowcharts at scale.


